


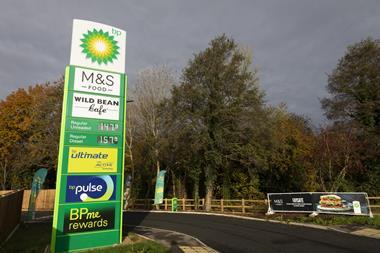
Annual shop sales were worth more than £641,000 in 2006, which represents an increase of 2.8% over the previous year in ’raw’ cash terms. If we look at the RPI measure of price inflation during the year, we find that it averaged 3.2% and was rising quite significantly towards the end of the year.
While the government tends to downplay RPI as an inflation indicator these days, it does give a long-term perspective of retail prices - and December 2006 saw the first rise of more than 4% since May 1998. What all this means is that while our shop sales figures are at an all-time high in cash terms, in real terms sales in 2006 were down by almost 0.5% on the previous year, and down by 1.7% from their ’real’ peak in 2004.
Once again, many commentators would point to two factors which played a part last year: a large surge in pump prices mid-year, which took the spend out of the shop in the summer, coupled with rising interest rates in the latter part of the year putting a brake on consumer spending more generally.
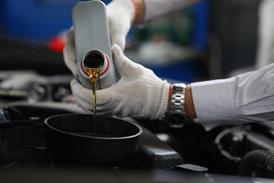
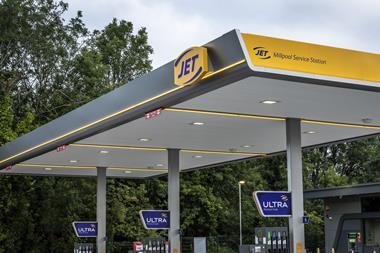
Fuel volumes were fractionally up in 2006, but the increase was so small as to be statistically insignificant. For the record, our ’average site’ pumped 4.984mlpa last year. This is essentially the same volume as we recorded in 2004 and 2005 - and to some extent that may be a result of the changing nature of our database population, rather than an absolute indicator of volumes elsewhere. After all, we do not have access to the volume figures from the likes of Tesco and Asda!
Wet-stock losses remained at an overall average of (0.19%) for 2006, unchanged from the previous year.
When it comes to stock levels and stock-turn we start to see some oddities arising, at least in part, from the rather high rate of inflation. In cash terms the average stockholding was £20,465 (at cost rather than retail value) - up by 4.8% from £19,530 in 2005. Consequently we also saw a fall in stock-turn from 25.3 times a year to 24.8 times in 2006. However, once we strip out inflation altogether, and use constant prices (from December 2003 in this instance), we find that average stockholding in 2006 was only £19,604, which is quite a drop from the peak recorded in 2003.
Average wage costs rose by 8.7% to £75,555 for the year, up from £69,478 in 2005. While this is a somewhat greater rise than had been shown in our annual wages report, that uses figures from each September, whereas a very large part of the increase occurred in the final quarter of 2006, and may well have been driven by the higher National Minimum Wage that came into effect on October 1, 2006.
As for average profits, they are subject to the usual caveat that there are as many ways of calculating the absolute figure as there are accountants, but that our own method is consistent from year to year. So our figure for 2006 was £22,019 which represents an increase of 12.4% on the previous year but is still considerably below the peaks recorded in 2002 and 2003 (£24,120 and £25,575 respectively) even before any adjustment for inflation.
As we said at the start there are both highlights and shadows in the picture of 2006. What is certainly quite odd about the year is that for the first time in some 10 years we have to look at ’price inflation’ when comparing annual sales figures. For most of the current decade we have seen annual RPI increases in the range of 1% to 2%, hence the jump of 4.4% from December 2005 to December 2006 is quite a change. From time to time we have published figures using inflation-adjusted sales values, but it has been quite a while since we’ve had to start putting them in to our reports.
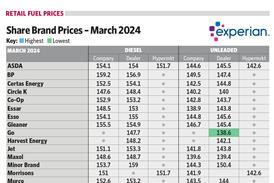
Taking a broader view, we wrote a year ago that perhaps 2005 had been a turning point for the UK petrol market in the sense that the hypers were no longer automatic price leaders. The experience of 2006 has rather confirmed that view, with Shell’s company-owned sites in particular emerging as one of the most aggressive players in the game and continuing that stance into 2007. As the market has changed so, to some extent, has the population of sites within our Database. But looking at the trends over the past 10 years of figures there is a reassuring degree of consistency to the results which gives us some confidence that results of 2006 are likely to represent a fair view of the ’average’ site experience.


No comments yet