Close menu
- Home
- News
- Reports
- Fuel
- Retail
-
Shop
- Back to parent navigation item
- Shop
- Shop Suppliers
- Alcohol
- Batteries
- Breakfast
- Car Care & Lubricants
- Chilled & fresh
- Confectionery
- Food to go
- Health & Beauty
- Hot Beverages
- Ice cream & frozen
- Mint & Gum
- Sandwiches & Snacks
- Seasonal
- Soft drinks
- Tobacco & Vaping
- Focus On Features
- A to Z of all Subjects
- Equipment
- Advice
- Events
- Vision
- Newsletters
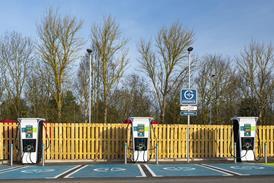

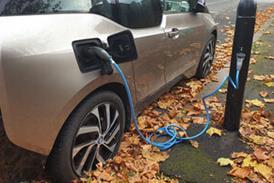


UK electric charging network growing at record rate
By Juliet Morrison2024-01-09T09:47:00
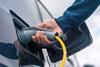
The UK’s network of electric vehicle chargers grew at its fastest rate last year, according to a new survey.
Already registered? Please log-in here
To continue reading, register for free today
With free guest access you can:
- Read unlimited articles
- Access the Fuel Market Review
- Read the latest Top 50 Indies report
- Sign-up for our newsletter
- Related Websites:
- Forecourt Trader Awards
- Grocery Retail News
- Convenience Store
- Industry Links:
- Petrol Retailers' Association
- Fuels Industry UK
- Lumina
Site powered by Webvision Cloud