Close menu
- Home
- News
- Reports
- Fuel
- Retail
-
Shop
- Back to parent navigation item
- Shop
- Shop Suppliers
- Alcohol
- Batteries
- Breakfast
- Car Care & Lubricants
- Chilled & fresh
- Confectionery
- Food to go
- Health & Beauty
- Hot Beverages
- Ice cream & frozen
- Mint & Gum
- Sandwiches & Snacks
- Seasonal
- Soft drinks
- Tobacco & Vaping
- Focus On Features
- A to Z of all Subjects
- Equipment
- Advice
- Events
- Vision
- Newsletters
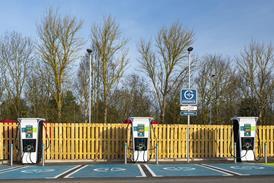

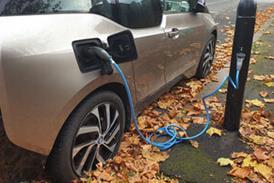


Public EV charger installation reaches nearly 50K, reports DfT
By Merril Boulton2023-11-01T14:00:00

There were 49,220 public electric vehicle charging devices installed in the UK up to October 1, 2023, according to the Department for Transport’s latest quarterly statistics published today (November 1).
Already registered? Please log-in here
To continue reading, register for free today
With free guest access you can:
- Read unlimited articles
- Access the Fuel Market Review
- Read the latest Top 50 Indies report
- Sign-up for our newsletter
- Related Websites:
- Forecourt Trader Awards
- Grocery Retail News
- Convenience Store
- Industry Links:
- Petrol Retailers' Association
- Fuels Industry UK
- Lumina
Site powered by Webvision Cloud